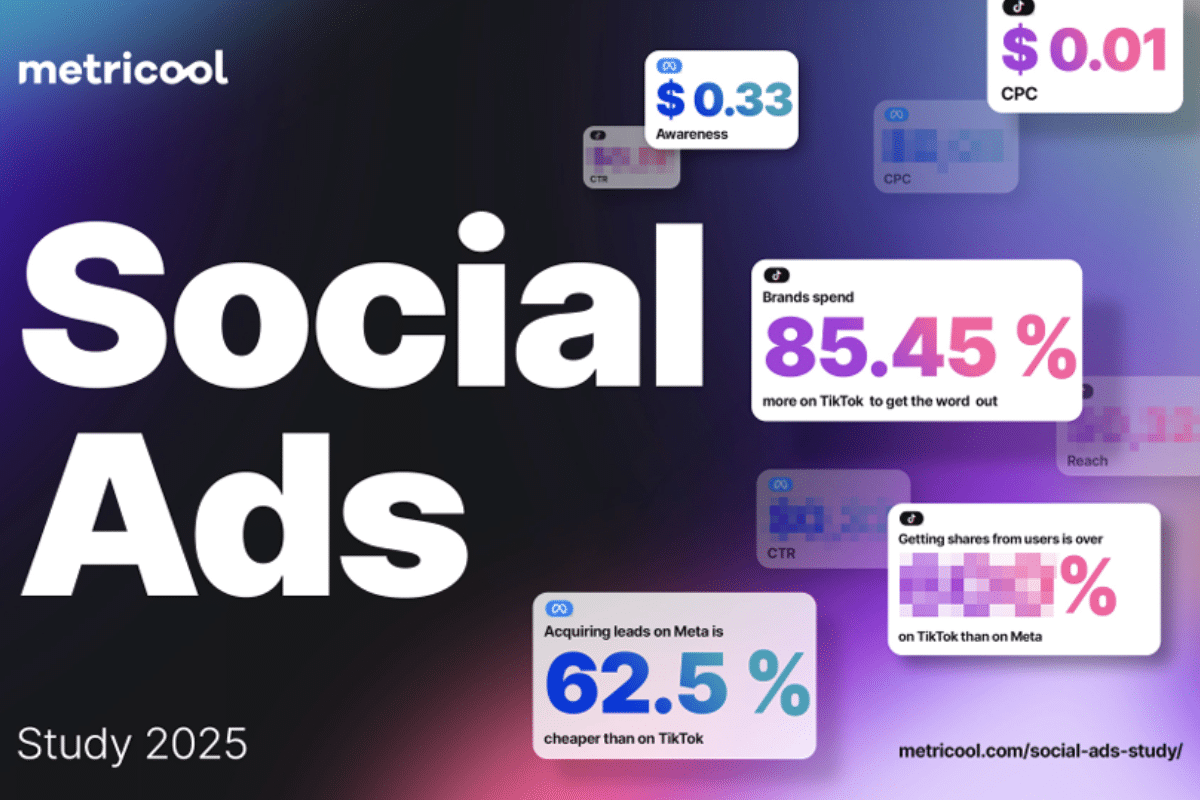
TikTok campaigns achieve 94% higher click-through rates than Meta while Meta sales campaigns generate over three times more conversions, according to a new Metricool analysis of $188 million in social media advertising spend across 503,281 campaigns during the first quarter of 2025.
TikTok demonstrates superior performance in driving website traffic, charging $0.01 per click, while Meta charges $0.05, resulting in brands paying 400% more per click on Meta platforms. TikTok also delivers 89% cheaper cost-per-action rates, with traffic campaigns generating 74.8% of all conversions on the platform.
Traffic campaigns represent the largest share of clicks on TikTok at 56.9%, while Meta’s traffic campaigns account for 33.2% of clicks. TikTok traffic campaigns maintain an average investment of $920.29 per campaign compared to Meta’s $1,182.63.
Meanwhile, Meta platforms significantly outperform TikTok in conversion-focused campaigns. Meta sales campaigns generate 61.3% of total conversions compared to TikTok’s 19.8% for web conversion campaigns. The cost-per-action for sales proves substantially lower on Meta at $0.13, compared to TikTok’s $0.94, making Meta over 600% more cost-effective for direct sales.
Lead generation campaigns show similar patterns. Meta’s potential client campaigns cost $1.34 per action while TikTok’s sales lead generation campaigns cost $3.57 per action, making Meta 62.5% cheaper for acquiring leads.
App promotion campaigns favor Meta with a cost-per-action of $1.96 compared to TikTok’s $2.61, though TikTok app promotion campaigns command higher average spending at $4,627.57 versus Meta’s $2,408.50.
Image source: Metricool
Brand Visibility Costs Remain Comparable
Both platforms charge similar rates for brand awareness campaigns, with TikTok’s cost per thousand impressions (CPM) at $0.32 compared to Meta’s $0.33. Despite the nearly identical pricing, brands spend 85.45% more on average for TikTok reach campaigns, indicating stronger confidence in the platform’s visibility potential.
TikTok reach campaigns generate 9 billion impressions, representing 34.1% of total campaign impressions, while Meta awareness campaigns produce 105 billion impressions, accounting for 34.4% of their platform’s total.
Campaign Duration Varies by Objective
Meta lead campaigns run longest at an average of 72 days, while interaction campaigns across platforms operate for the shortest duration at 25 days. Only 2.5% of brands use both TikTok and Meta advertising simultaneously.
Video view campaigns represent 24% of brand preferences and command the highest cost-per-click at $0.51, followed by app promotion campaigns at $0.42. Recognition campaigns generate the most impressions at 34.4%, with outreach campaigns close behind at 34.1%.
Image source: Metricool
Platform Investment Strategies Differ
Brands allocate their social advertising budgets differently across platforms. On TikTok, web conversion campaigns receive the largest investment share at 31.6%, despite representing only 21.1% of total campaigns. Video view campaigns account for 24% of campaigns but receive 14% of investment.
Meta exhibits a different pattern, with sales campaigns receiving 36% of the total investment, while representing 11.2% of campaigns. Interaction campaigns comprise 37.2% of Meta campaigns but receive only 13% of investment allocation.
The data reveals that potential client campaigns on Meta attract 26.3% of investment for 12.3% of campaigns, while traffic campaigns receive 14.8% of investment for 31% of campaigns.
Image source: Metricool
Performance Metrics Highlight Platform Strengths
The study identifies traffic campaigns as generating 30.8% of interactions on Meta platforms. App promotion campaigns demonstrate the highest average spending across both platforms, with TikTok averaging $4,627.57 and Meta averaging $2,408.50 per campaign.
Interaction advertisements represent brands’ most favored campaign type at 37.2% usage, while recognition campaigns generate the highest impression volumes. The analysis reveals that brands often maintain app promotion campaigns for extended periods, despite their high cost-per-click rates.
The study analyzed advertising campaigns from 49,417 ad accounts on TikTok and Meta platforms (Facebook, Instagram, and WhatsApp), resulting in over 114 billion impressions and 1.8 billion interactions across all platforms between January and March 2025.
Dragomir is a Serbian freelance blog writer and translator. He is passionate about covering insightful stories and exploring topics such as influencer marketing, the creator economy, technology, business, and cyber fraud.


TikTok campaigns achieve 94% higher click-through rates than Meta while Meta sales campaigns generate over three times more conversions, according to a new Metricool analysis of $188 million in social media advertising spend across 503,281 campaigns during the first quarter of 2025.
TikTok demonstrates superior performance in driving website traffic, charging $0.01 per click, while Meta charges $0.05, resulting in brands paying 400% more per click on Meta platforms. TikTok also delivers 89% cheaper cost-per-action rates, with traffic campaigns generating 74.8% of all conversions on the platform.
Traffic campaigns represent the largest share of clicks on TikTok at 56.9%, while Meta’s traffic campaigns account for 33.2% of clicks. TikTok traffic campaigns maintain an average investment of $920.29 per campaign compared to Meta’s $1,182.63.
Meanwhile, Meta platforms significantly outperform TikTok in conversion-focused campaigns. Meta sales campaigns generate 61.3% of total conversions compared to TikTok’s 19.8% for web conversion campaigns. The cost-per-action for sales proves substantially lower on Meta at $0.13, compared to TikTok’s $0.94, making Meta over 600% more cost-effective for direct sales.
Lead generation campaigns show similar patterns. Meta’s potential client campaigns cost $1.34 per action while TikTok’s sales lead generation campaigns cost $3.57 per action, making Meta 62.5% cheaper for acquiring leads.
App promotion campaigns favor Meta with a cost-per-action of $1.96 compared to TikTok’s $2.61, though TikTok app promotion campaigns command higher average spending at $4,627.57 versus Meta’s $2,408.50.
Image source: Metricool
Brand Visibility Costs Remain Comparable
Both platforms charge similar rates for brand awareness campaigns, with TikTok’s cost per thousand impressions (CPM) at $0.32 compared to Meta’s $0.33. Despite the nearly identical pricing, brands spend 85.45% more on average for TikTok reach campaigns, indicating stronger confidence in the platform’s visibility potential.
TikTok reach campaigns generate 9 billion impressions, representing 34.1% of total campaign impressions, while Meta awareness campaigns produce 105 billion impressions, accounting for 34.4% of their platform’s total.
Campaign Duration Varies by Objective
Meta lead campaigns run longest at an average of 72 days, while interaction campaigns across platforms operate for the shortest duration at 25 days. Only 2.5% of brands use both TikTok and Meta advertising simultaneously.
Video view campaigns represent 24% of brand preferences and command the highest cost-per-click at $0.51, followed by app promotion campaigns at $0.42. Recognition campaigns generate the most impressions at 34.4%, with outreach campaigns close behind at 34.1%.
Image source: Metricool
Platform Investment Strategies Differ
Brands allocate their social advertising budgets differently across platforms. On TikTok, web conversion campaigns receive the largest investment share at 31.6%, despite representing only 21.1% of total campaigns. Video view campaigns account for 24% of campaigns but receive 14% of investment.
Meta exhibits a different pattern, with sales campaigns receiving 36% of the total investment, while representing 11.2% of campaigns. Interaction campaigns comprise 37.2% of Meta campaigns but receive only 13% of investment allocation.
The data reveals that potential client campaigns on Meta attract 26.3% of investment for 12.3% of campaigns, while traffic campaigns receive 14.8% of investment for 31% of campaigns.
Image source: Metricool
Performance Metrics Highlight Platform Strengths
The study identifies traffic campaigns as generating 30.8% of interactions on Meta platforms. App promotion campaigns demonstrate the highest average spending across both platforms, with TikTok averaging $4,627.57 and Meta averaging $2,408.50 per campaign.
Interaction advertisements represent brands’ most favored campaign type at 37.2% usage, while recognition campaigns generate the highest impression volumes. The analysis reveals that brands often maintain app promotion campaigns for extended periods, despite their high cost-per-click rates.
The study analyzed advertising campaigns from 49,417 ad accounts on TikTok and Meta platforms (Facebook, Instagram, and WhatsApp), resulting in over 114 billion impressions and 1.8 billion interactions across all platforms between January and March 2025.
Get the full analysis here.